Do oil companies regulate production at the well? Do they change how much a well produces depending on price? I’m not sure how this works, as each of our wells rise and fall. I’ve tried to keep a graph to see if our production is slowing, but it’s all over the place. If someone could explain, it would be awesome! Thanks
It could be that your wells have been shut in a few days because of fracking of new wells in the surrounding area. If you will give the State, County, Section, Block, Township, Range, etc. (exact location) it would help. I’m sure someone can help you.
They are in Pecos County, Texas. Section 19.5 -8
GIS mapping does not show a Section 19.5-8…try again for ‘exact’ Section and Block or the Abstract #.
Block 8, Sec 19.5 (A-6533). CLR Whiskey River wells.
4237139588 4237139880 4237139881 4237139589
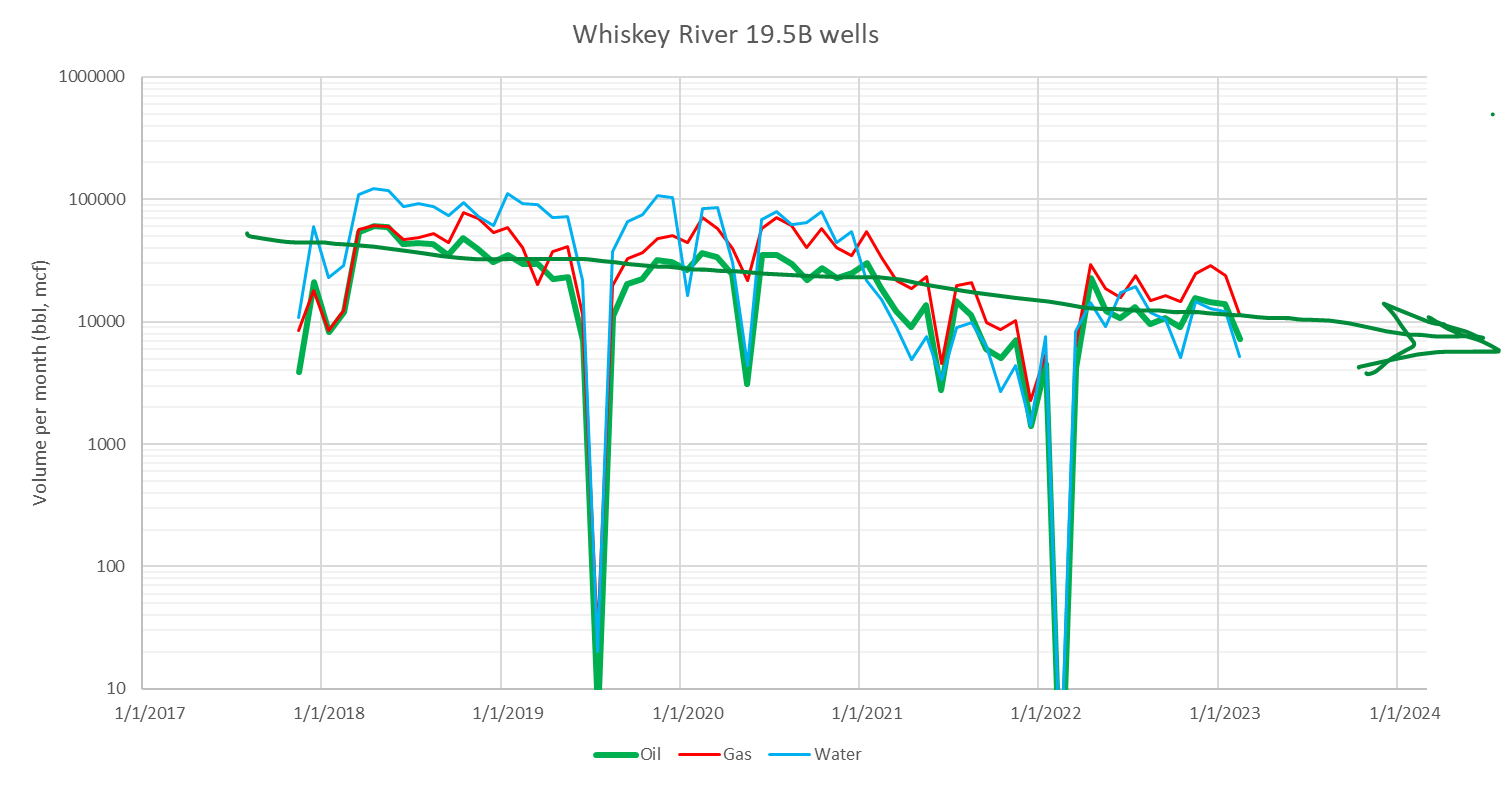
They seem to individually be all over the place, if one trusts the individually allocated volumes. I really don’t think anyone is regulating production based on price. They are all on some sort of artificial lift (rod pump or gas lift) and I would guess that craps out at times and they aren’t always rushing out to fix it.
Here are all wells at once. More or less on decline with a couple of low points where something mechanical wasn’t working IMO
Thank you. I know they are declining. I just didn’t think it would be at such a drastic rate the last couple of months.
Sorry it’s off topic but how are you generating such a nifty graph? ![]()
Graph is just Excel. I mean you have to get the data first. (from RRC etc).
This topic was automatically closed after 90 days. New replies are no longer allowed.