Understanding Seismic 3D on GIS Map

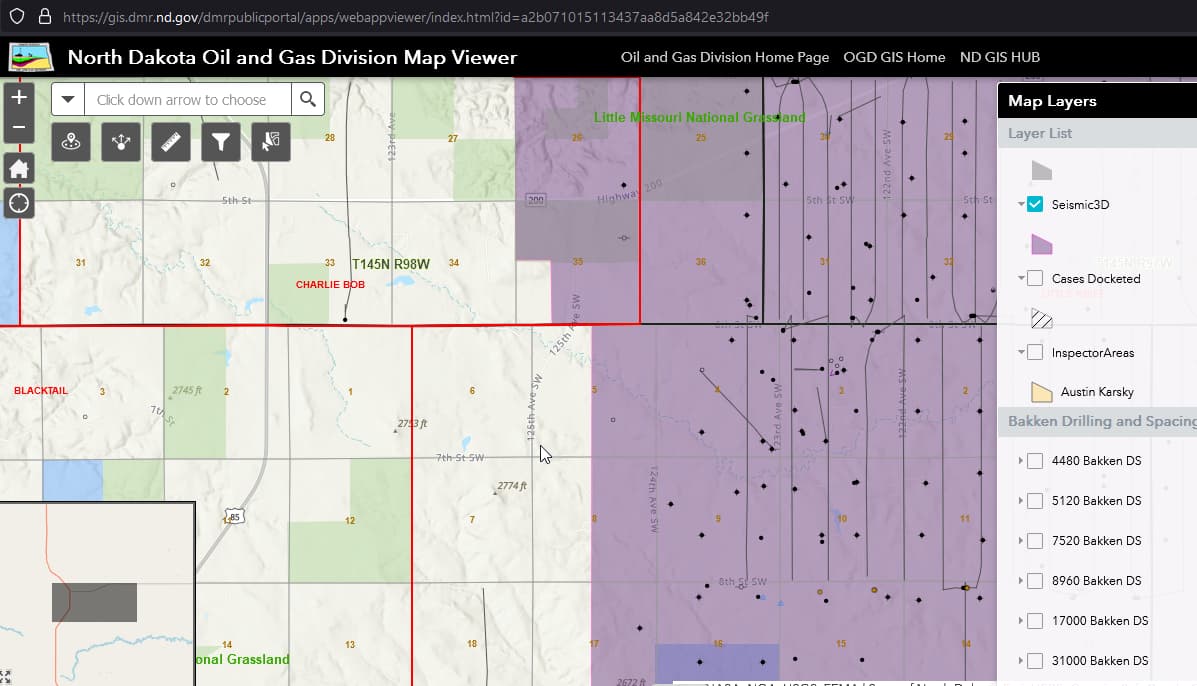
Hi, We are currently evaluating a lease for mineral rights in Section 6 of Billings County ND. I have been doing some research and was able to display a filter on the GIS map called Seismic 3D. I assume this map shows where seismic testing has been done and shows there is oil present in the purple shaded areas. I have a few questions:

  1. Does the purple shading mean there is oil confirmed underground?
  2. How do I know if our section has had seismic testing done on it?
  3. Can we get a seismic study done on our land or is this not advisable?

Our section is just outside the shaded area however the shaded area stops in a straight line which makes me think that perhaps the seismic data was only measured on that section next to ours. Perhaps the oil extends to our land as well and just hasn’t been measure. Interested to hear in your feedback. I am attaching the photo below (See section 6 in the middle).

  1. NO. The purple only outlines the general shape of the seismic survey. By itself, it does not indicate any oil. However, since there are multiple horizontal wells in several sections, that does indicate hydrocarbons.

  2. If your section is covered by a purple zone, then a seismic survey has been done. If no purple, then no seismic-yet. You may or may not have the current reservoir of interest under your section.

  3. It costs quite a bit to do a survey. The general public does not have the funding nor the expertise to interpret the results.

  4. If you have never leased before, get a good oil and gas attorney to look at the draft lease. The draft is not usually in the mineral owner’s favor and needs quite a bit of editing. NEVER hand over a lease without getting paid the same day.

Thanks for clearing that up Martha. That makes a lot of sense. We just contacted Argent group and several other attorneys and will get some guidance before signing.

This topic was automatically closed after 90 days. New replies are no longer allowed.