Map of tier 1,2,3 etc drilling locations

i read about top tier, secondary tier . . . fringe areas in the delaware basin - is there a map(s) which shows these???

and, do the bone spring and all the wolfcamp [phantom, A, B, C, D] contour the same in the tier ratings?? i would suspect not, so are there published maps for these target formations individually?

i’ve done some research and did find this interesting information dated oct, 2018, which provides a nice [i.e. understandable and easy to read] structural and stratigraphic overview including several good maps and cross sections regarding wolfcamp in permian basin:

however, i have not been able to locate tier maps.

we are in s11, blk 3, h&gn reeves.

2 Likes

I’ve just heard that WCMP A is the best. Congratulations, on your Diamondback wells!

1 Like

Several Delaware/Permian E&P companies brag about concentrating on “premium” acreage, and include maps in quarterly PowerPoint presentations that enable one to locate a few of their best well clusters. However, Diamondback’s presentation map is too high level (13 counties) to figure their best areas, as you may know.

I believe the maps you are seeking will likely be proprietary and not shared externally by companies. I think you will need to find someone who has reversed engineered maps from reported production. It might be worth the effort to Art Berman’s article “PERMIAN BASIN BREAK-EVEN PRICE IS $61: THE BEST OF A BAD LOT”

a bit more info i dug up:

recognizing delaware tight formation plays are in avalon and down to basal wolfcamp and go from more oil to more gas with depth 'cause the thermal profile is more mature with depth [so i understand], as a mineral owner in this area, how does a person know if they are in tier 1, 2, 3 or fringe? if an owner wants to sell or renew a lease it would kinda be nice to understand the terminology going around today in reference to their ownership location . . . like, for example, what is a tier 1 zone? example, the wells in what is being called ‘phantom wolfcamp’ on the tract i am under - what tier wells are those? having a father who was a landman, i understand independents drill when they can put a deal together which may or not be the best prospect, but what about those majors with large contiguous tracts, how are they defining the tiers?

a couple more links:

discussion with some maps regarding drilling tiers [23 October 2019]:

here is an excerpt “Formation matters, but how much? Superior formation quality is a notable value-add but not the sole performance differentiator in the basin—45 percent of wells in Tier 1 zone had a well productivity <1,000 boed per 10,000 feet perforated interval.”

from me: how are they defining/differentiating Tier 1 zone predrill? what is the criteria and can it be areally mapped so one can say, ‘this tract is in and this one is out’?

and, from today, interview with Scott Sheffield chief executive officer at Pioneer Natural Resources:

where, once again, he discusses drilling tier 2 and tier 3 prospects, etc.

as mineral owners, how do we know what tier we are in? any thoughts, anyone?

Image from Art Berman’s article “PERMIAN BASIN BREAK-EVEN PRICE IS $61: THE BEST OF A BAD LOT”

AJ11, can you expand on how to read that graphic? I’m confused by what the legend represents.

Below are links to websites with robut interactive data tools. If you can find your lease in the second one, there is a value calculator. I have no way of knowing how accurate it might be.

1.) Permian – update through July 2019

2.) Oil & Gas Properties in Texas

3.) Shale Reality Check 2019 November 12, 2019

TwoShoeBeagie7, I believe the color codes represent EURs and that the author is offering at certain oil prices [$45 and $60] wells must have minimum EURs to break-even. So at $45 oil, a 200,000 EUR well will not break-even but a 383,000 BOE EUR will break-even. I have not read the article since it was published and shared the image to show a possible alternative to proprietary maps assembled by companies which, best guess, will likely not be made public.

Those Wolfcamp maps are extremely outdated. For instance, there are basically no data points in Lea County where there are almost 700 Wolfcamp producers, and likely is the best place to drill a well in the Delaware. A 287kboe EUR well is terrible.

NMoilboy, Are you saying the EURs for mapped areas other than Lea county should be adjusted up because of actual, normalized production numbers? Are maps with so-called Tier 1,2, and 3 acreage available to Jane and Joe Mineralowner, and of how much value would they be? How much of the tiered acreage talk is Wizard of Oz earnings call bluster?

I’m saying that map was made a long time ago when stimulations were a lot smaller and there was a whole lot less well data. A current map would have much larger values and would show a larger economic area. So it’s not a great map to use to define tiers.

Geology and well performance varies. I’m sure operators have tiers of available drill locations. I’m sure in their public info they exaggerate a bit on # of wells and per well recoveries, because that is what operators do. But I’m sure they have groupings of wells based on expected returns/performance.

IMO it helps the mineral owner to have a realistic idea of where one’s acreage is located and the odds of it getting developed. That said, I doubt there are tier maps available to anybody. One could take it upon oneself to make some, I guess… if one had the production data and a clear understanding of what wells were in each zone. I could probably do it but it would be a pain.

A non-QC’d Wolfcamp oil rate map might look something like this:

2 Likes

NMoilboy – I’m sure that is one wonderful map… but would you please expand on the color coding… also, what does ‘non-OC’d’ stand for. Thanks – Later – Buzz

I think my posts in this thread are generally in agreement with what you have said. I don’t have a subscription to a data service as you do so I have to rely on publicly available information like Art Berman’s historic posts and links #1 and #2 above. How many of the tight oil drillers are in precarious financial positions. Are their Cash Flows divided by Capital Expenditures generally </= 1 ?

1 Like

Non-QC’d = no quality control applied. I just had the mapping software create a map from the raw input without taking any time to check the inputs or trying to resolve anything that might look weird. So it may be more “splotchy” then a map that one spent some time creating.

That is a map of peak monthly oil for a well, in barrels. So 30,000 = well made 1,000 barrels per day in it’s peak month. Red is anything above 70,000. Here was the scale.

image

1 Like

AJ,

Oh yeah its a complete poopshow for lots of operators. Or service companies. Or mineral buyers. Pretty much everyone is working on the concept that they can borrow money to pay for the development of acreage that they borrowed money to buy. Money dries up. Then things go kabloooey. Maybe.

Imagine when the entire sector (small cap producers) has seen its stock go down by almost 60% in a year. Do you think anyone wants to invest in those companies? Yikes.

2 Likes

NMOilboy – you do good work! Thanks for sharing – Later – Buzz

Recently found this:

And this:

Both pretty similar and seem fairly similar to the map from NMoilboy. So hopefully pretty accurate.

These are great mats, thanks for sharing, out of curiosity does anybody have a similar map for the Midland basin?

Midland Basin maps will come up in search - keywords: tier map, midland basin, names of producing zones, etc. Sorry, but I found some along the way but did not save except for the last one in this post.

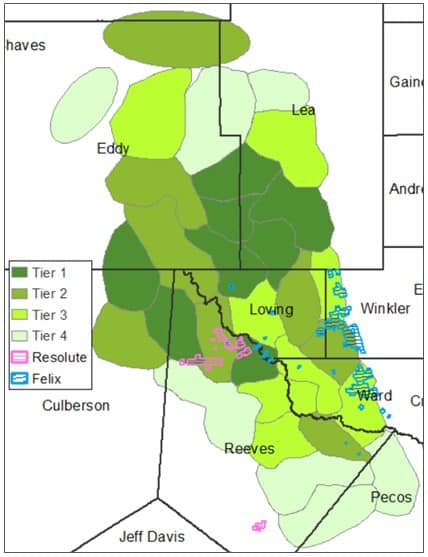
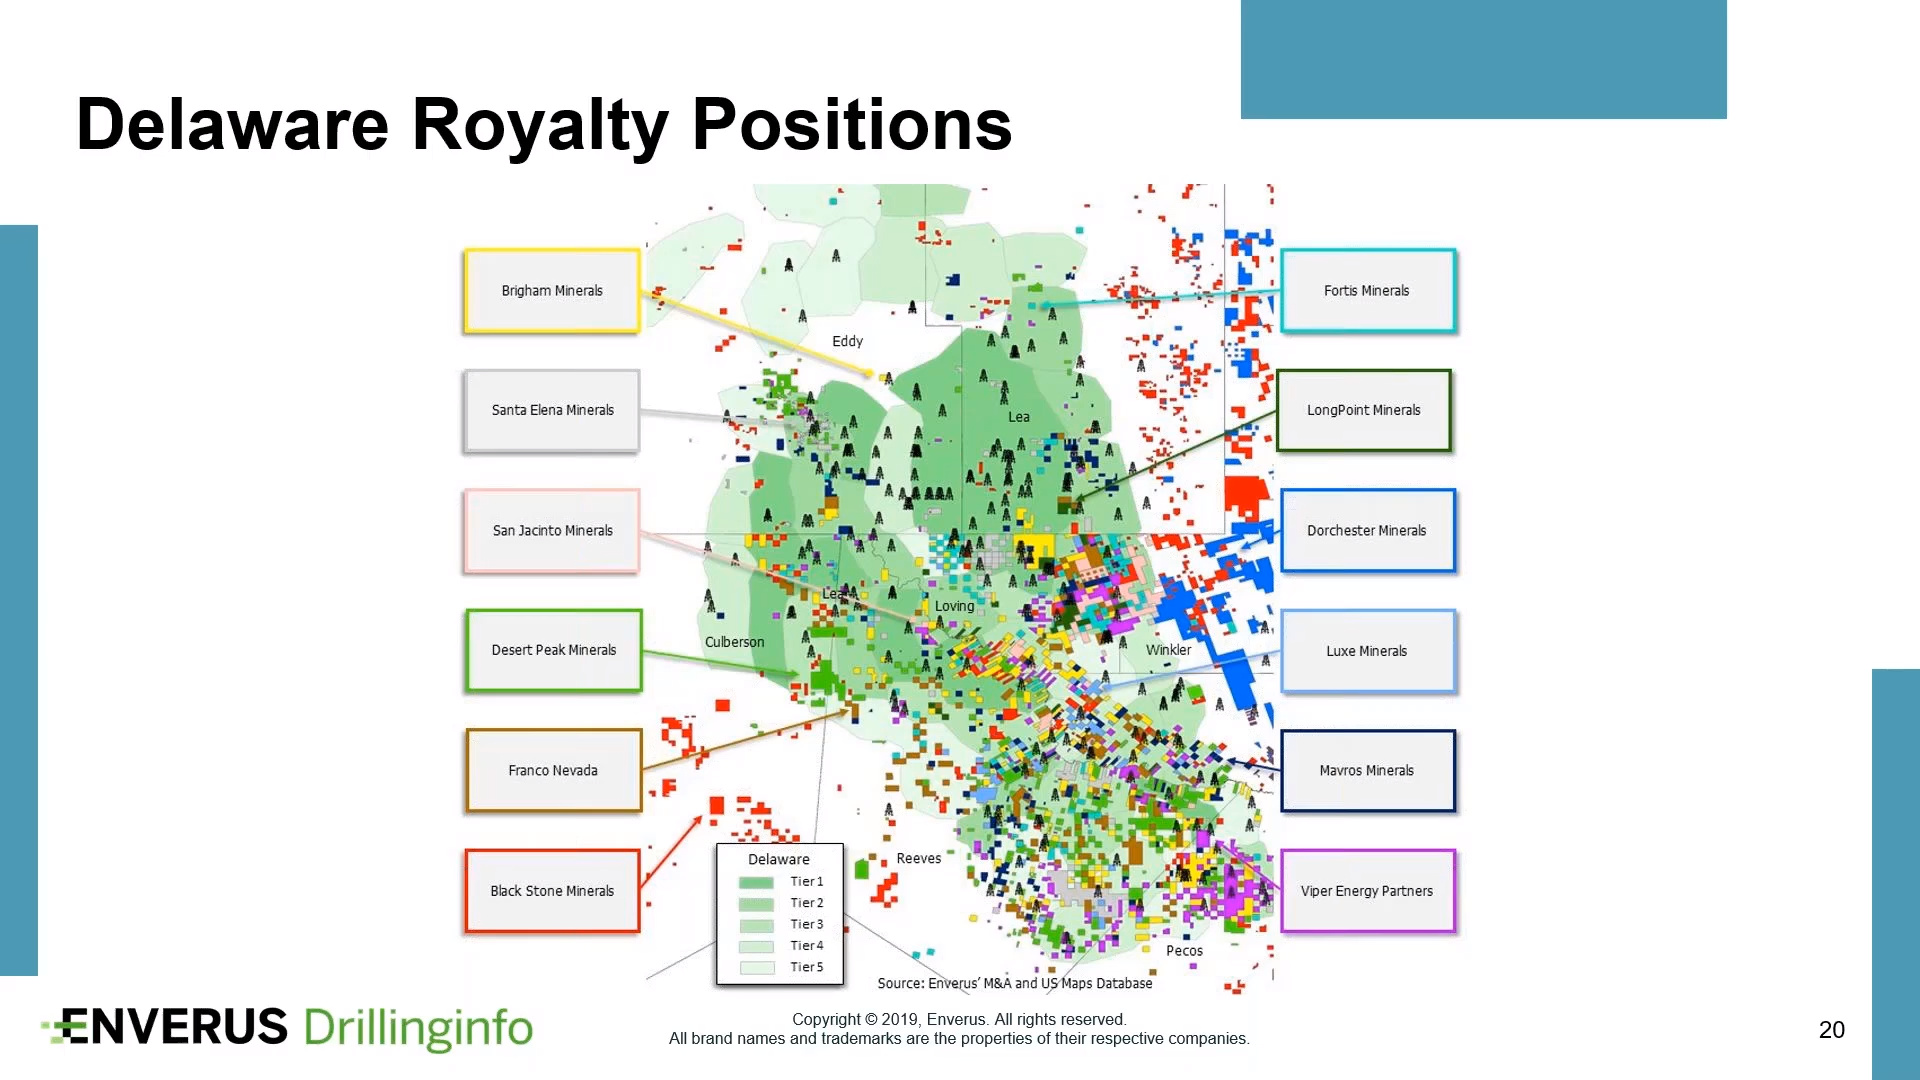
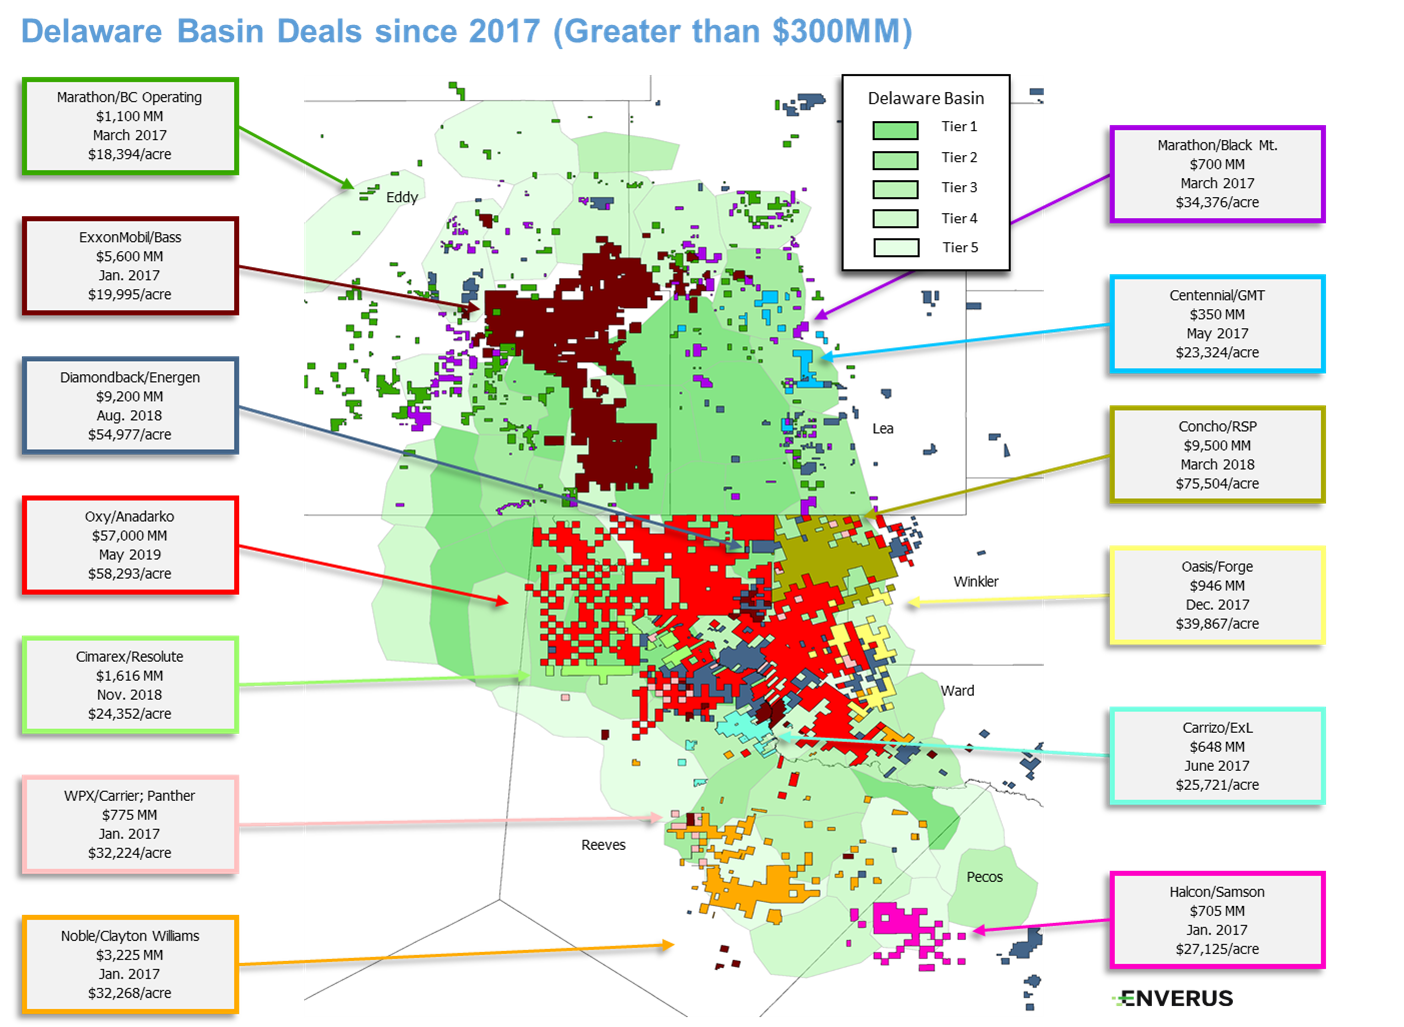
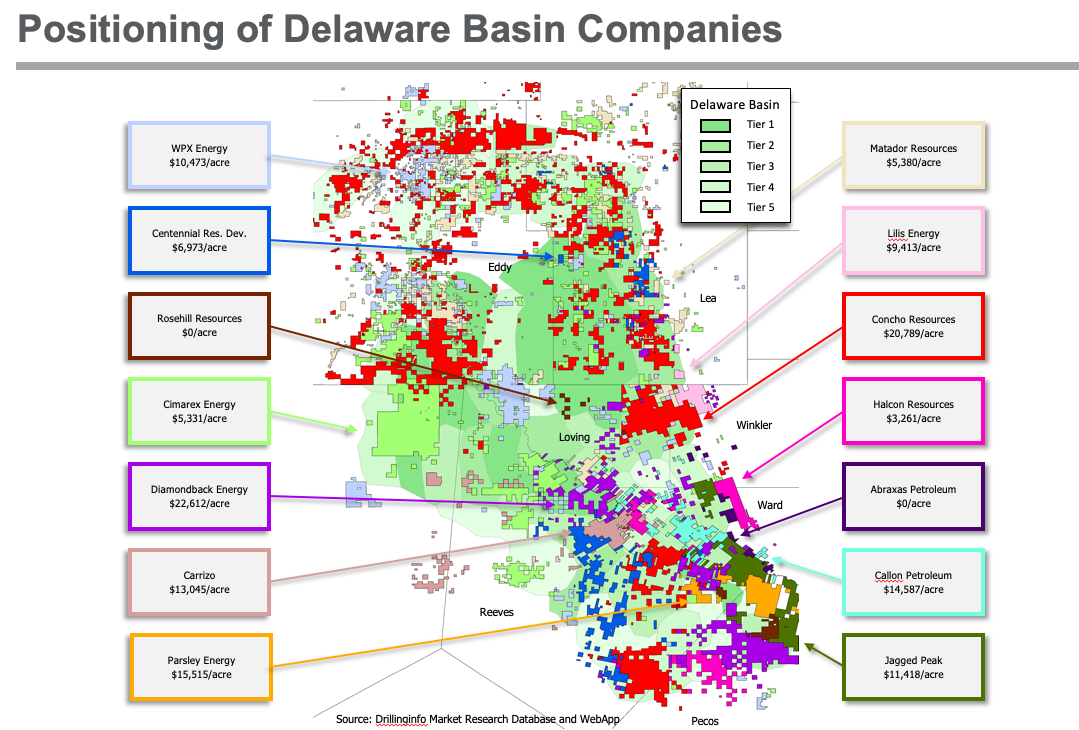
Here are two more Delaware Basin tier maps. They appear to be using the same base as the one Armadillo posted of Delaware Royalty Positions.

.

Thanks to all who chimed in on this question. I understand much more now. It does appear that an individual company’s tier rating is based on their best subsurface analysis combined on what they might want to present publically . . . this basin is so drilled out (at least in the upper Wolfcamp zone) probably their annual report of tier holdings can not be overstated too much.

I am assuming the maps we have seen are for Wolfcamp A and one might assume that what they are calling Phantom Wolfcamp would track closely to Wolfcamp A.

For Wolfcamp B, C and D; we know D has a basal unconformity and is actually not Permian but Pennsylvanian however from there up it is all conformable and since basin influencing tectonics was the same until the end of the Wolfcamp one would assume the tier maps we are looking at for the upper A sequence would be tracked by the lower sequences . . . I guess if and when more of the deeper B is drilled we shall begin to see.

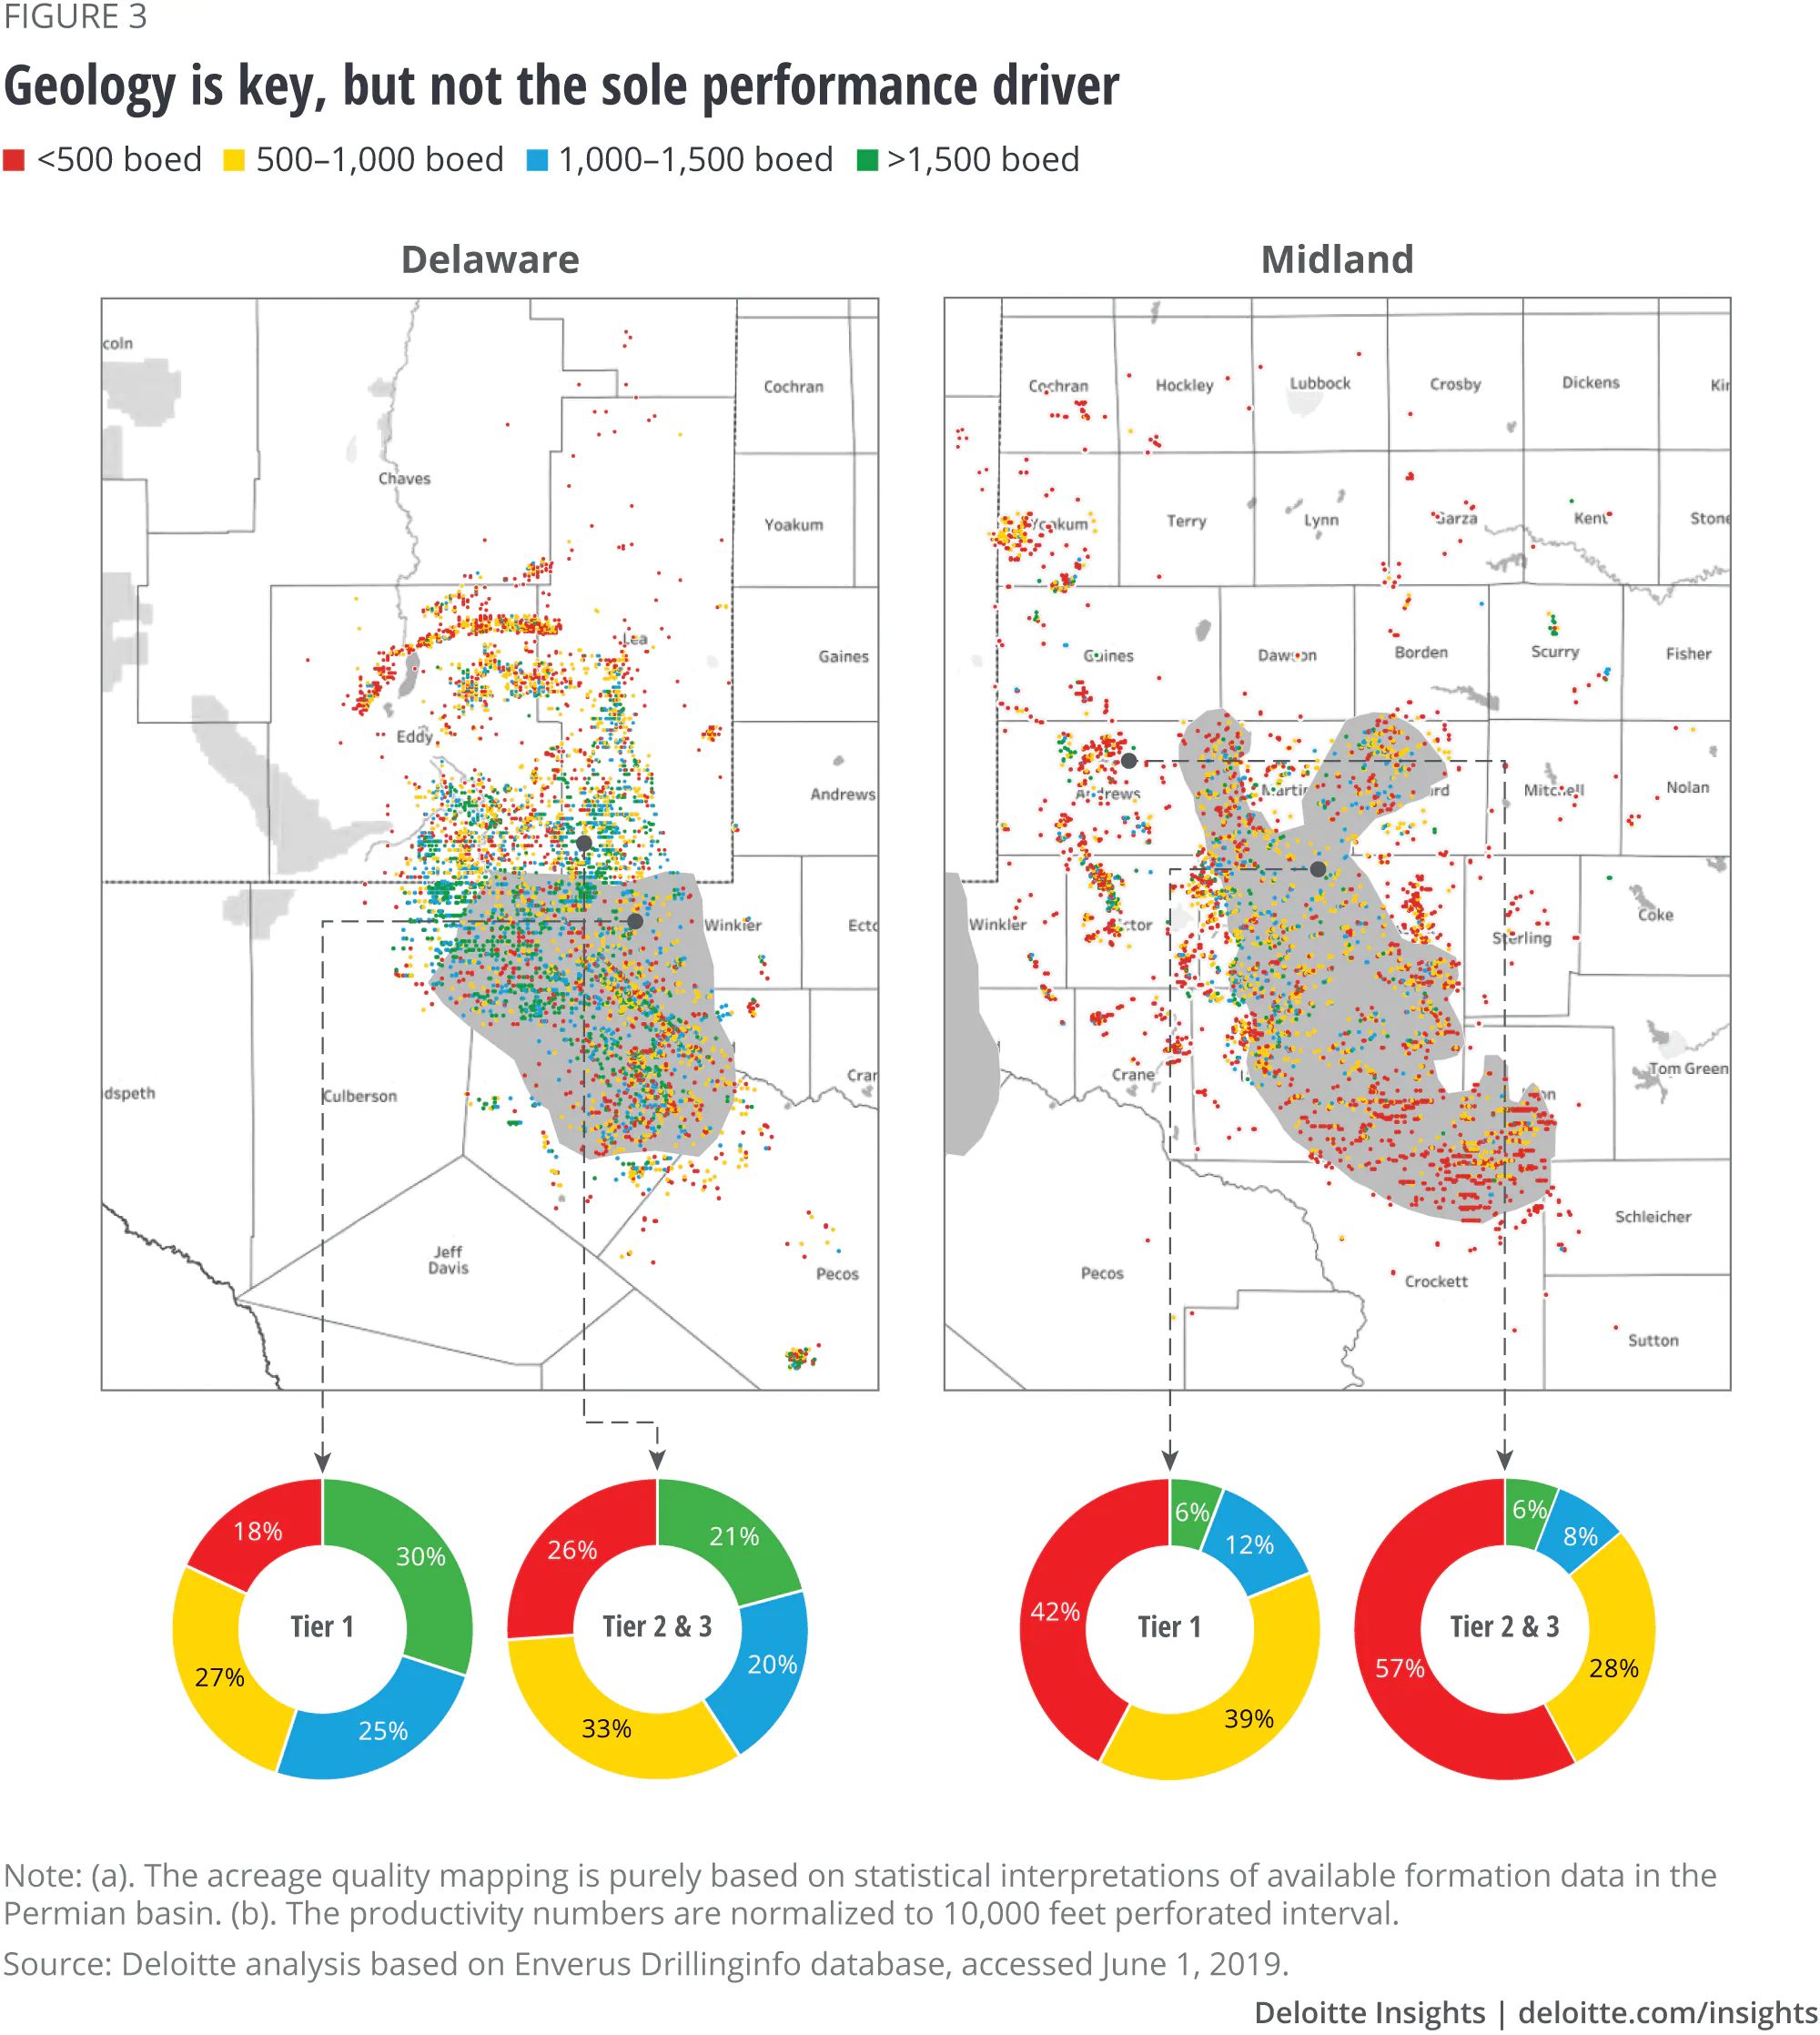
Regarding if a mineral owner is out of luck by not being under a Tier 1 location, this is from a Deloitte report dated, 23 October 2019:

" Formation matters, but how much? Superior formation quality is a notable value-add but not the sole performance differentiator in the basin—45 percent of wells in Tier 1 zone had a well productivity <1,000 boed per 10,000 feet perforated interval."

and,

" No straight answers: A better combination of formation type and engineering design seems to explain the Permian’s superior performance, but shale’s nonlinear response to completion parameters makes it challenging to pinpoint answers."

So, according to Deloitte, those not in Tier 1 areas may still have as good a well as one in a Tier 2/3 area. Here is the Deloitte map to support that statement, it shows, by their analysis, that Tiers 2/3 statistically have made quite a few nice wells.