5 - 12N - 6W: any activity there? New owner/member – thanks so much!
Looks like TPR Mid Continent has some cases at the OCC. If you are a new owner, make sure the county clerk has your name affiliated with your tract. A pooling is set for any day now and you do not want to miss it if you are not leased. You will only have 20 days to answer.
The bigger answer is yes, there is horizontal drilling in the township with several different companies.
If you are leased, then just sit back and wait for development. If you are not, then you need to be aware of the lease clauses that will hurt you. Friend me if you need help. Blue icon next to my name. I am a mineral owner, not a landman.
I am leased. How do I go about making sure the County Clerk affiliates me with my tract - or has this most likely happened once the lease was signed? Thanks.
If you are leased, they know about you.
Hey - What’s 5/12N/6W looking like at this point? Also believe I have ownership in 8/12N/6W - anything going on there? Thanks!
There are 3 plugged wells and a gas well that is active but not producing much at all (just over 500 mcf a month). My relative owns some interest there. He says he hasn’t seen anything progress with TRP; they might have lost their interest in that section, but there is plenty of activity in the area, just not there unfortunately.
So - anything new with 5/12N/6W? Last I heard it was tied up in the courts but I’ve heard nothing concrete in a very long time. Meanwhile 8/12N/6W is beginning to pay off. Thanks for whatever anybody can tell me!
Well location was approved in April of 2018. Pooling was approved on March 27, 2018. They have one year in which to spud. I don’t see a permit listed yet.
Thank you, Obi-Wan – you are often our only hope (for information)!
I just know where to hunt the galaxy. some days. You can watch for the permit here: http://imaging.occeweb.com/imaging/OGWellRecords.aspx
Type 0512N06W in the legal location box. I just tried it, but nothing there yet.
TPR seems to be moving a bit slowly this year. They may be juggling their rig portfolio or financing. Young company, but made up of very experienced folks from the majors.
You asked about 8-12N-6W earlier. Bonzai 1206 8-1WH was unfortunately dry. Plugged in Nov 2017.
Bonzai 1206 8-1MHR is listed as active as of Jan. 20, 2018, so you should have received a Division Order and royalties by now. Here is the link to the OK tax site. Use the leading zero in the location box.
https://www2.oktax.onenet.net/GrossProduction/gp_displayPublicPUNListSearchDownload.php
We have indeed gotten the first check for 8. Your assistance, wisdom and accessibility are all greatly appreciated!
Excellent. Then you are good to go for now.
If I could bother you with something brief – My brother-in-law (who is the brains behind our holdings in Oklahoma!) has researched this chart which he says shows predicted output in Oklahoma. He’d like me to find out if this looks correct to you, again simply in terms of past performance and speculation. (The dollar amount is not applicable, just the graph itself in terms of time passage.) Feel free to pass on this but if you have any thoughts they’d be appreciated – thanks!
Jim
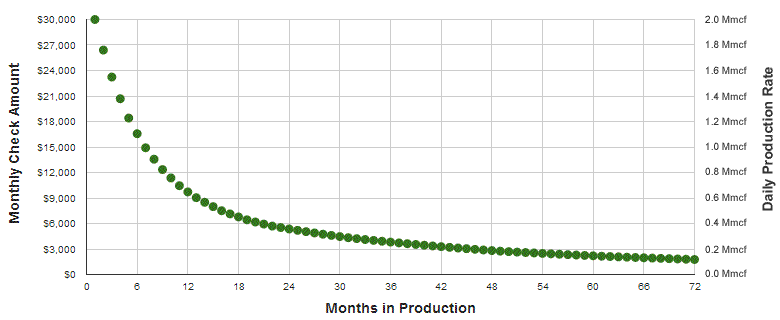
In general, the shape is correct if you are assuming a horizontal well. However, it will be totally dependent upon price of product, any NGL’s or condensate value added in, any shut-ins of nearby wells for a brief period of time, what reservoir, what the choke opening is, what the wetness of the gas is, the sourness of the crude, etc. Anyone looking at this needs to ask if this is the price per acre, what is the royalty, etc. Also, if horizontal, it could extend out for decades and the very low rates. This graph only has gas. Many wells have both oil and gas. The real curves tend to look a lot bumpier as the price changes every month.
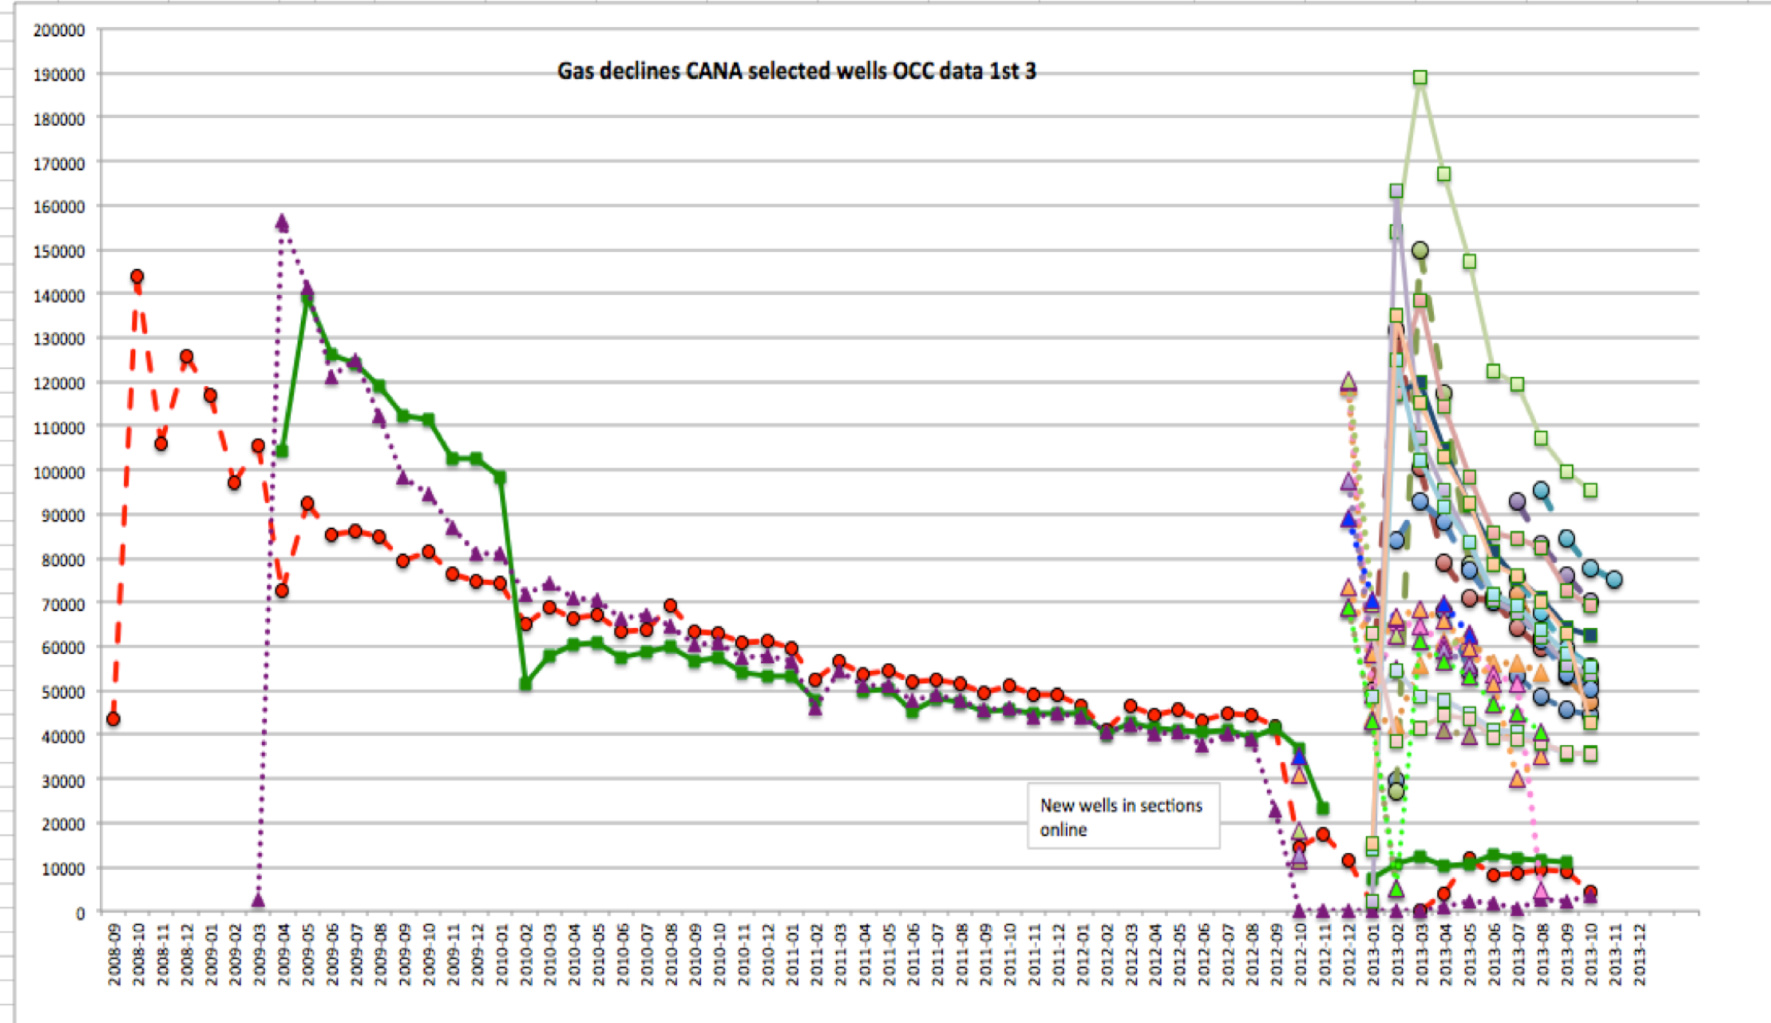
Here is an example of some wells in the early CANA area-just the gas posted. The first three years are from three wells in nearby sections. Then each of those sections had eight additional wells drilled. Look how different each one was! Some higher, some lower. My left axis is production per month. One of these days when I have time, I will fill in the next five years to see how those other wells did and how they converged (or not) to something similar.
1 Like
Martha. If you send me your API list I can send you the data dump from DI if you would like.
James.
If you send me the location I can send you my curves from PHDWin (reserve engineering program).
I had engineering run for most of the HZ wells in the mid-con (at least 2 stream). You can model the NGL component and run economics based off commodity prices and well costs, that way you will know when you hit economic limit.
Thanks for the offer! I have DI, that is how I made this graph a few years ago. I just haven’t had time to post it again and update for all the wells in my spreadsheet. On my to do list…I do think it would be useful for folks to see and understand.
1 Like
Thank you very much! And like all Oklahomans in your area, I understand! Only one “catch”—please call me and I will explain. My Okie friends, my wife is at school and I need this to remain confidential.