LEONA FAYE 1-20-29-32XHS in Section 20-6N-6W. Picture from State Hwy 19 looking East.
2 Likes
That is a pretty sight (and site)! Thanks for the pictures.
1 Like
Great news. Is site access off of CR 1400? Or across the river from there?
I mean site? Thanks for the info.
Yes, site access off CR 1400 from State Highway 19.
May I ask how far away 20-4N-5W is from 20-6N-6W? Just hopeful thinking!
With the same section number it’s 6 miles per Township and 6 miles per Range, so 2 Townships (6N - 4N = 2) and 1 Range (6W - 5W = 1) 2 + 1 = 3 x 6 = 18 miles (not as a crow might fly).
1 Like
Thanks, Don, for this map!
Wowza, Don! Thank you for the map and for all of the information you share; navigating the coolest inheritance ever has been an amazing journey. My Grandparents chose their spots very well! I wish my mom were here to enjoy it. This map is mint!
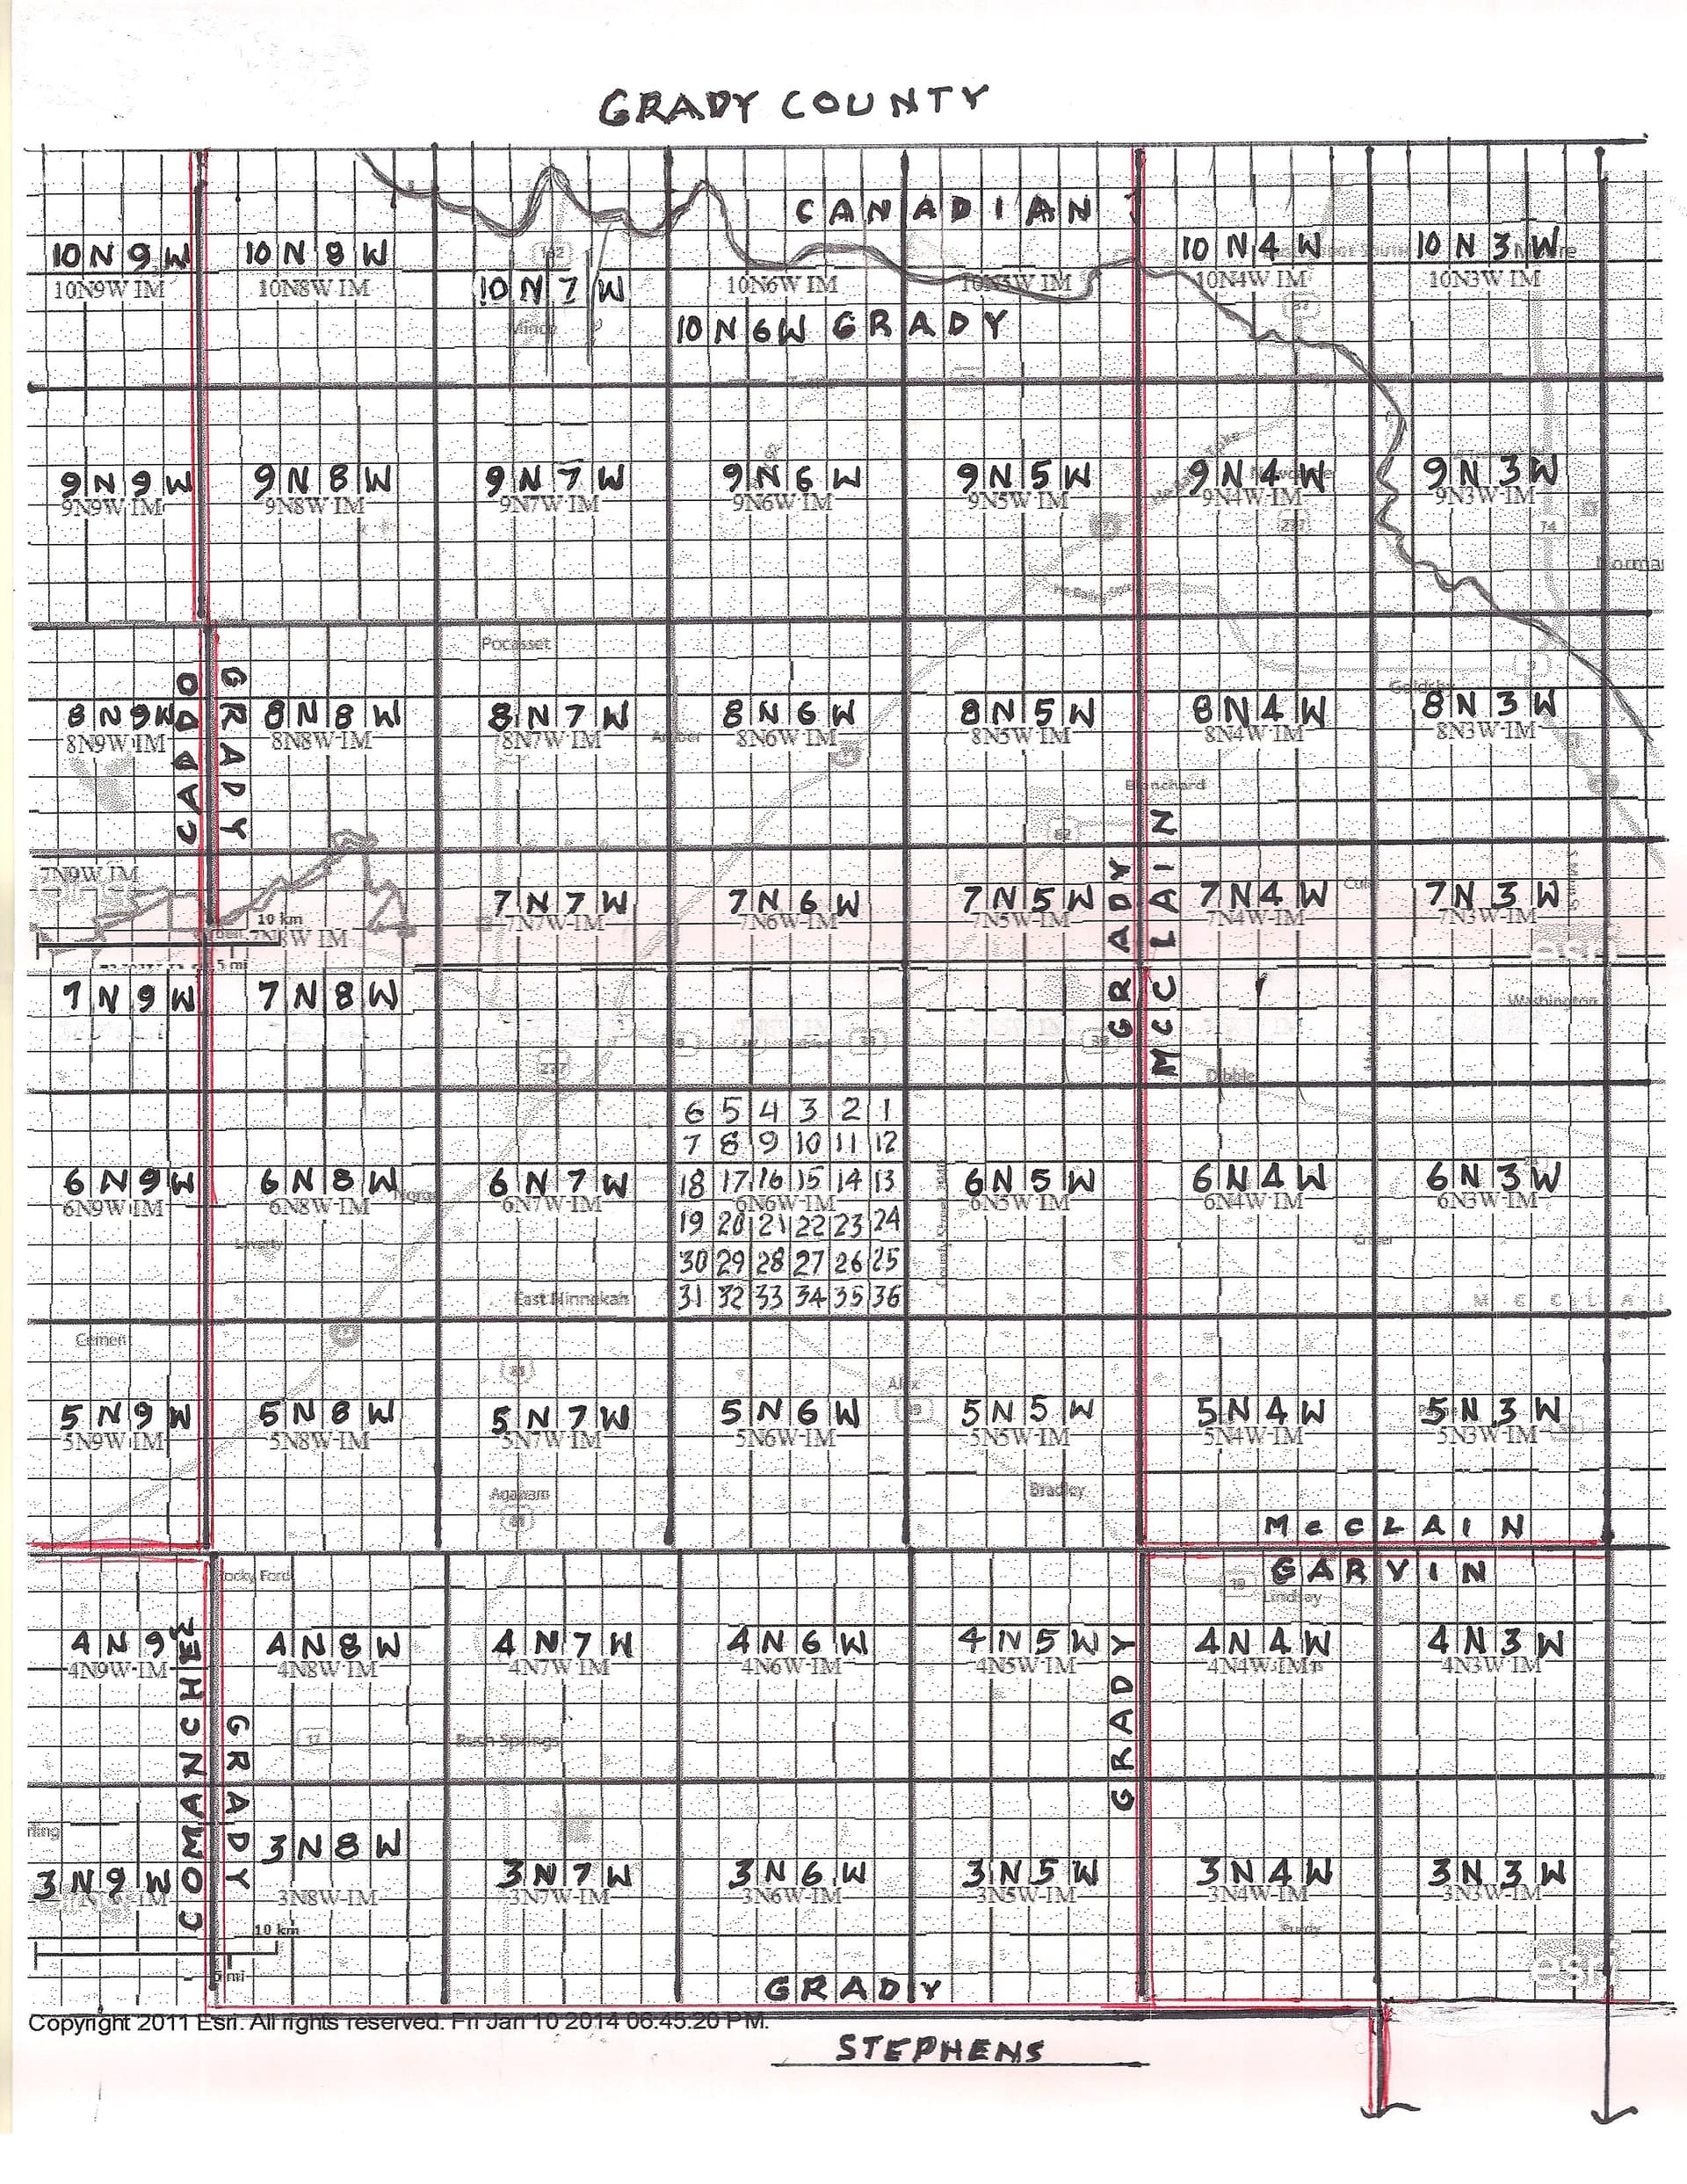
Grady County Map.pdf (434.4 KB)
Here is a highway map so you can located your acreage.
Martha, thank you for all of your wonderful information! I have learned so much from you, (and Don!); your generosity to those of us who have so many questions has been instrumental in knowing what we own and where! You rock.
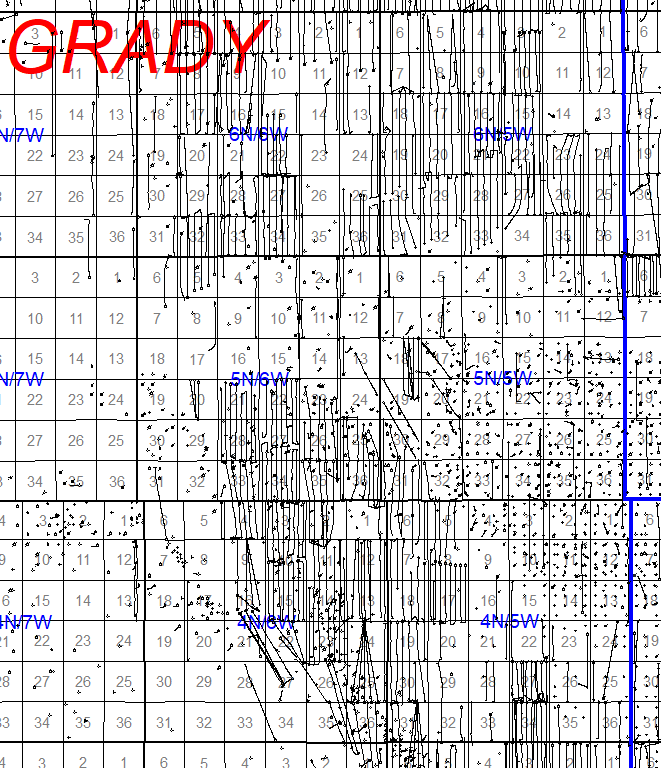
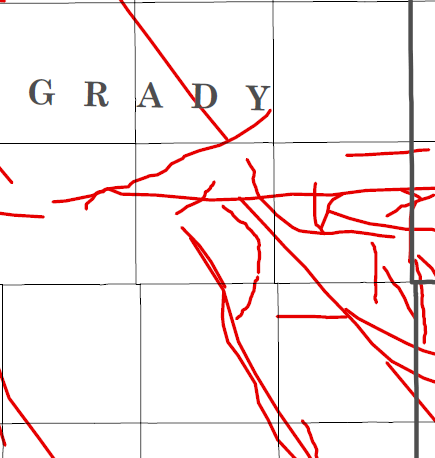
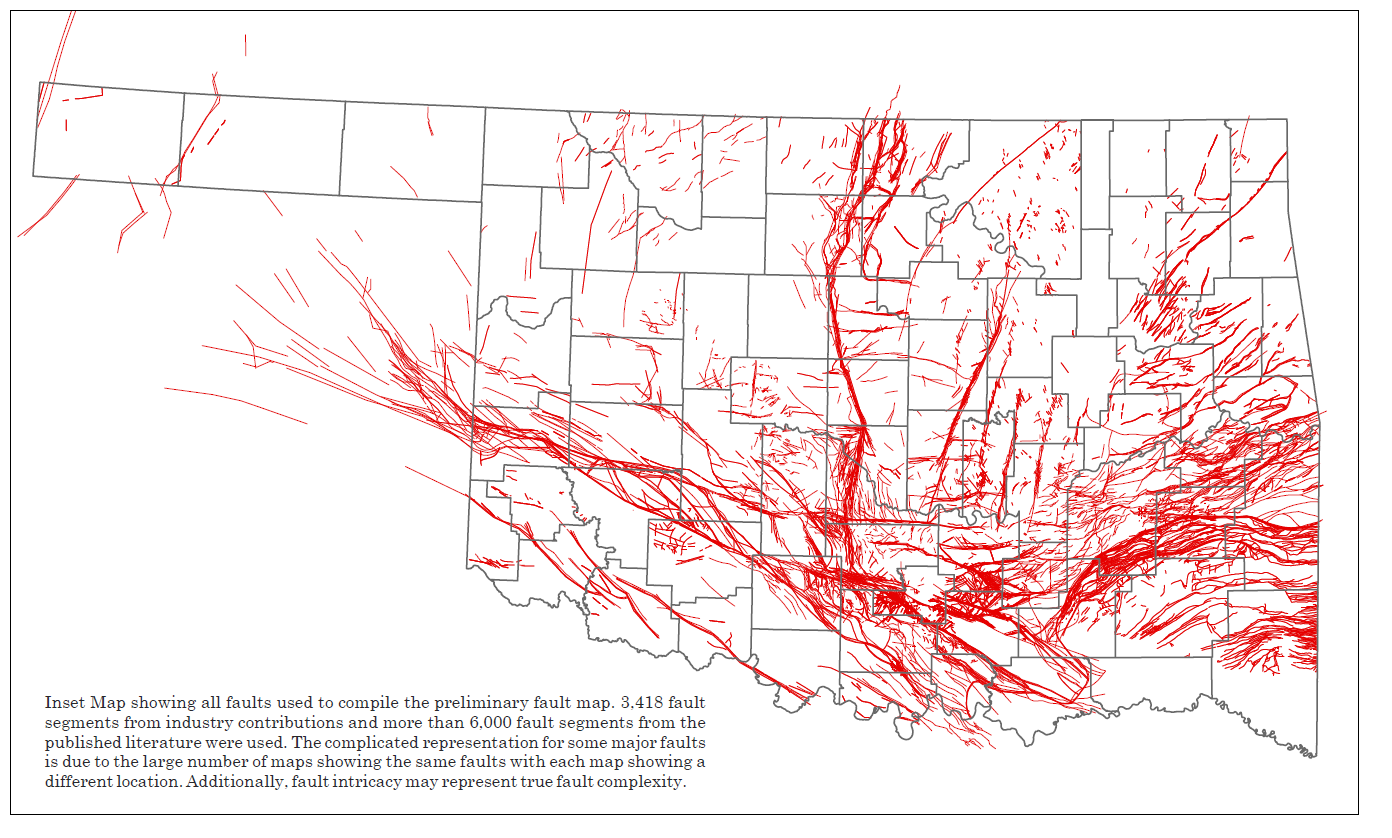
And if you overlay the fault with wells, you can see the patterns. I see some more faults, but this gives you an idea of why the drilling is where it is! Faults are not always vertical, so where they cut the horizons matters. I don’t know the source of honeyman’s fault map. I overlaid the general lines of the dry gas, wet gas and condensate and the oil with associated gas lines for the Woodford zone. The upper Mississippian zones would have their own stripes.

Faults are not good as far as drilling oil is concerned, correct?
What do all the vertical lines designate?
The mostly vertical lines on the map are the paths of the horizontal wells that have been drilled and projected to be drilled.
Very good map M-Barnes! Note the smaller number of horizontal wells being drilled in 5N-6W between faults… that will probably change in time.
I thought that was the fault map you used. Recognized the red lines.
The gas, condensate and oil lines are from an operator’s presentation a few years ago. Not hard lines, just estimates based upon GORs I would surmise. But notice how they follow the fault lines. The Woodford is deeper to the southwest, so the hydrocarbons has been cooked more due to time and pressure (simple version).
Faults offset the reservoirs, so you do not particularly want a fault in your borehole because you might lose pay section. Also faults can have pressure differentials on either side of the fault, so it makes drilling more difficult. Fluids can also leak up those faults into higher reservoirs, so that is not all bad.